


Every year headlines proclaim the imminent demise of the nation due to terrible, horrible, very bad NAPLAN results. But if we look at variability and results over time, it’s a bit of a different story.
I must admit, I’m thoroughly sick of NAPLAN reports. What I am most tired of, however, are moral panics about the disastrous state of Australian students’ school achievement that are often unsupported by the data.
A cursory glance at the headlines since NAPLAN 2022 results were released on Monday show several classics in the genre of “picking out something slightly negative to focus on so that the bigger picture is obscured”.
A few examples (just for fun) include:
Reading standards for year 9 boys at record low, NAPLAN results show
Written off: NAPLAN results expose where Queensland students are behind
And my favourite (and a classic of the “yes, but” genre of tabloid reporting)
‘Mixed bag’ as Victorian students slip in numeracy, grammar and spelling in NAPLAN
The latter contains the alarming news that “In Victoria, year 9 spelling slipped compared with last year from an average NAPLAN score of 579.7 to 576.7, but showed little change compared with 2008 (576.9). Year 5 grammar had a “substantial decrease” from average scores of 502.6 to 498.8.”
If you’re paying attention to the numbers, not just the hyperbole, you’ll notice that these ‘slips’ are in the order of 3 scale scores (Year 9 spelling) and 3.8 scale scores (Year 5 grammar). Perhaps the journalists are unaware that the NAPLAN scale ranges from 1-1000? It might be argued that a change in the mean of 3 scale scores is essentially what you get with normal fluctuations due to sampling variation – not, interestingly, a “substantial decrease”.
The same might be said of the ‘record low’ reading scores for Year 9 boys. The alarm is caused by a 0.2 score difference between 2021 and 2022. When compared with the 2008 average for Year 9 boys the difference is 6 scale score points, but this difference is not noted in the 2022 NAPLAN Report as being ‘statistically significant’ – nor are many of the changes up or down in means or in percentages of students at or above the national minimum standard.
Even if differences are reported as statistically significant, it is important to note two things:
1. Because we are ostensibly collecting data on the entire population, it’s arguable whether we should be using statistical significance at all.
2. As sample sizes increase, even very small differences can be “statistically significant” even if they are not practically meaningful.
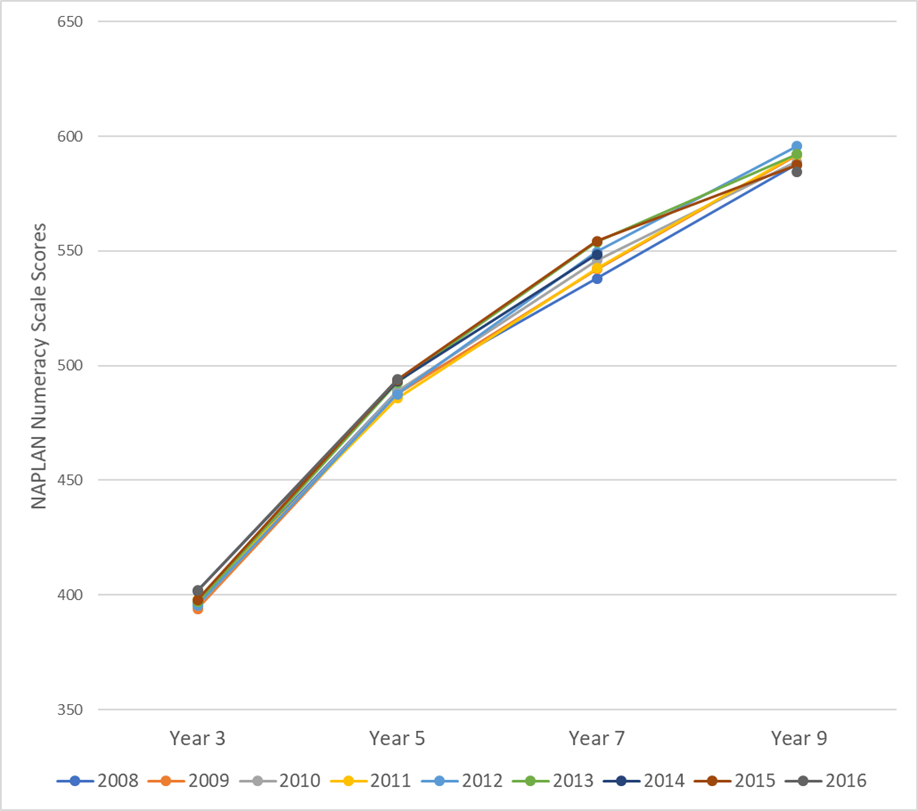
Figure 1. NAPLAN Numeracy test mean scale scores for nine cohorts of students at Year 3, 5, 7 and 9.
The practical implications of reported differences in NAPLAN results from year to year (essentially the effect sizes) are not often canvassed in media reporting. This is an unfortunate omission and tends to enable narratives of largescale decline, particularly because the downward changes are trumpeted loudly while the positives are roundly ignored.
The NAPLAN reports themselves do identify differences in terms of effect sizes – although the reasoning behind what magnitude delineates a ‘substantial difference’ in NAPLAN scale scores is not clearly explained. Nonetheless, moving the focus to a consideration of practical significance helps us ask: If an average score changes from year to year, or between groups, are the sizes of the differences something we should collectively be worried about?
Interestingly, Australian students’ literacy and numeracy results have remained remarkably stable over the last 14 years. Figures 1 and 2 show the national mean scores for numeracy and reading for the nine cohorts of students who have completed the four NAPLAN years, starting in 2008 (notwithstanding the gap in 2020). There have been no precipitous declines, no stunning advances. Average scores tend to move around a little bit from year to year, but again, this may be due to sampling variability – we are, after all, comparing different groups of students.
This is an important point for school leaders to remember too: even if schools track and interpret mean NAPLAN results each year, we would expect those mean scores to go up and down a little bit over each test occasion. The trick is to identify when an increase or decrease is more than what should be expected, given that we’re almost always comparing different groups of students (relatedly see Kraft, 2019 for an excellent discussion of interpreting effect sizes in education).
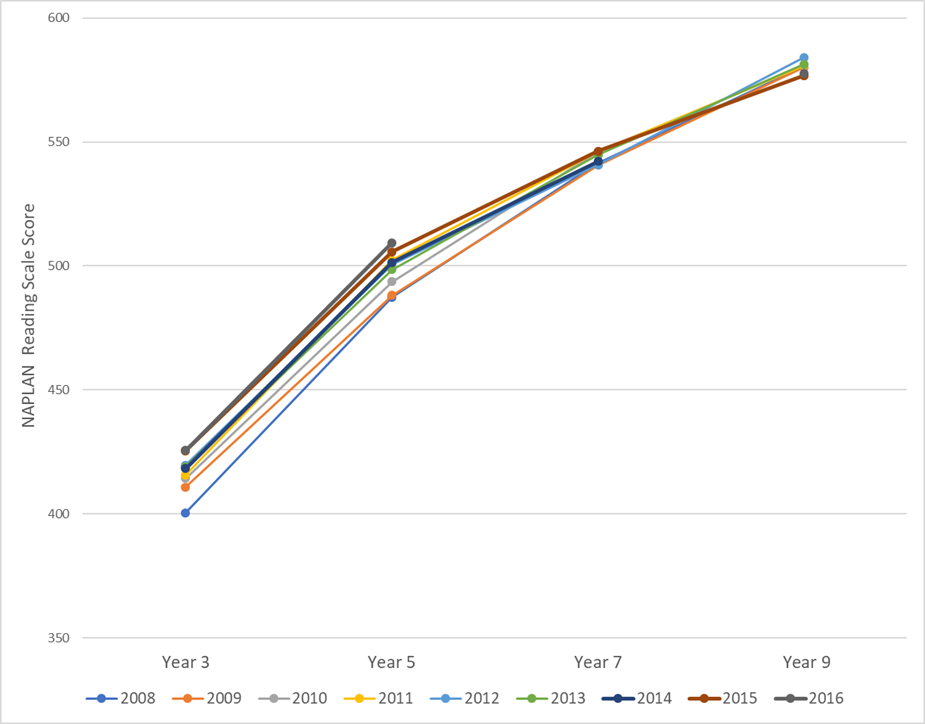
Figure 2. NAPLAN Reading test mean scale scores for nine cohorts of students at Year 3, 5, 7 and 9.
Plotting the data in this way it seems evident to me that, since 2008, teachers have been doing their work of teaching, and students by-and-large have been progressing in their skills as they grow up, go to school and sit their tests in years 3, 5, 7 and 9. It’s actually a pretty good news story – notably not an ongoing and major disaster.
Another way of looking at the data, and one that I think is much more interesting – and instructive – is to consider the variability in achievement between observed groups. This can help us see that just because one group has a lower average score than another group, this does not mean that all the students in the lower average group are doomed to failure.
Figure 3 shows just one example: the NAPLAN reading test scores of a random sample of 5000 Year 9 students who sat the test in NSW in 2018 (this subsample was randomly selected from data for the full cohort of students in that year, N=88,958). The red dots represent the mean score for boys (left) and girls (right). You can see that girls did better than boys on average. However, the distribution of scores is wide and almost completely overlaps (the grey dots for boys and the blue dots for girls). There are more boys at the very bottom of the distribution and a few more girls right at the top of the distribution, but these data don’t suggest to me that we should go into full panic mode that there’s a ‘huge literacy gap’ for Year 9 boys. We don’t currently have access to the raw data for 2022, but it’s unlikely that the distributions would look much different for the 2022 results.
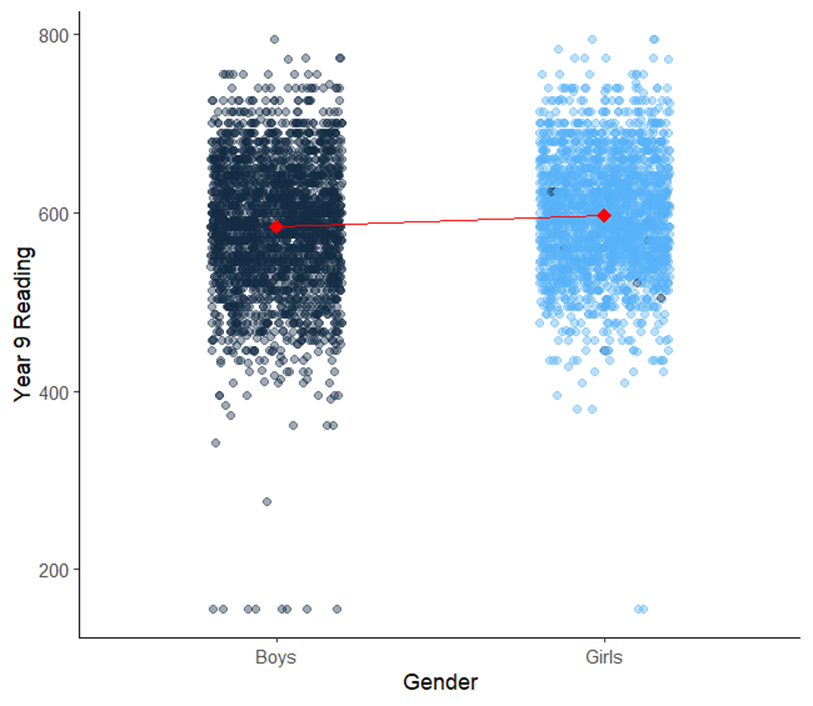
Figure 3. Individual scale scores and means for Reading for Year 9 boys and girls (NSW, 2018 data).
So what’s my point? Well, since NAPLAN testing is here to stay, I think we can do a lot better on at least two things: 1) reporting the data honestly (even when its not bad news), and 2) critiquing misleading or inaccurate reporting by pointing out errors of interpretation or overreach. These two aims require a level of analysis that goes beyond mean score comparisons to look more carefully at longitudinal trends (a key strength of the national assessment program) and variability across the distributions of achievement.
If you look at the data over time NAPLAN isn’t a story of a long, slow decline. In fact, it’s a story of stability and improvement. For example, I’m not sure that anyone has reported that the percentage of Indigenous students at or above the minimum standard for reading in Year 3 has stayed pretty stable since 2019 – at around 83% up from 68% in 2008. In Year 5 it’s the highest it’s ever been at 78.5% of Indigenous students at or above the minimum standard – up from 63% in 2008.
Overall the 2022 NAPLAN report shows some slight declines, but also some improvements, and a lot that has remained pretty stable.
As any teacher or school leader will tell you, improving students’ basic skills achievement is difficult, intensive and long-term work. Like any task worth undertaking, there will be victories and setbacks along the way. Any successes should not be overshadowed by the disaster narratives continually fostered by the 24/7 news cycle. At the same time, overinterpreting small average fluctuations doesn’t help either. Fostering a more nuanced and longer-term view when interpreting NAPLAN data, and recalling that it gives us a fairly one-dimensional view of student achievement and academic development would be a good place to start.

Sally Larsen is a Lecturer in Learning, Teaching and Inclusive Education at the University of New England. Her research is in the area of reading and maths development across the primary and early secondary school years in Australia, including investigating patterns of growth in NAPLAN assessment data. She is interested in educational measurement and quantitative methods in social and educational research. You can find her on Twitter @SallyLars_27

Thanks Sally. I enjoyed your analysis.
Thanks Sally – such a reasonable and sensible take on this.
Thanks Sally for breaking open the NAPLAN data and explaining that the data does not indicate an ongoing and major disaster. It would be great to see this in the mainstream media.
Thanks for this important article. Like you I am sick of NAPLAN and standardised tests in general though the commentary from OECD on PISA is valuable. The sooner standardised tests are discarded in favour of formative evaluation, as shown to be effective by Black & Wiliam some years ago, the better. Of course that requires teachers to be trusted.
Standardised tests take place a long time after the instruction, memory of which is tested. They don’t provide any relevant information about what influences performance, and therefore don’t motivate effort. They can lead to stress: a judgement is coming. And they skew the time spent on a broad curriculum. Teaching music would be more effective.
It is appalling and more that commentators, including journalists, rush to criticise students for their “failures” but use interpretations which show a lack of understanding of basic statistics and as you show of the data. I wonder how they did at school. Comments on PISA results focus on league tables which are meaningless.
You may appreciate this comment by one of my favourite researchers, the late Ken Rowe, then at ACER, “‘Australian politicians and senior bureaucrats currently advocating the publication the results of tests in league tables “are naively, and in typical fashion, stomping around in an uninformed epistemopathological fog”.
NAPLAN and similar summative tests take place a long time after the instruction, memory of which is tested. Except for PISA they don’t provide any relevant information about what influences performance, and therefore don’t motivate effort. They can lead to stress: a judgement is coming. And they skew the time spent on a broad curriculum. Teaching music would be more effective.
Previous research, such as that by Angelique Howell, reveals important perspectives of the students required to sit the tests which impose an adult perspective of student’s experience, which are not highlighted by those who frame education policy