NAPLAN

Why you can’t identify gifted students using NAPLAN

Some schools rely on NAPLAN results to identify gifted students, a trend that is leading to many high-potential learners being overlooked and neglected. New research outlines the mistake of using this standardised assessment as the only identification tool for giftedness when it was never designed or intended for this purpose.

There are over 400,000 gifted students in Australia’s schools (approximately 10% of school students), but there are no national identification practices or national means of collecting information about Australian school students who are gifted.It has been over 20 years since the last national inquiry into the education of gifted and talented children in Australia. Despite two senate inquiries (one in 1988 and one in 2001), there are no national initiatives aimed at reducing the impact of ongoing problems in identifying and supporting the needs of gifted learners. It is a national disgrace that gifted students are among some of the most underserved and neglected students in our schools.

The Contentious Belief in NAPLAN for Identifying Giftedness

In education, we constantly strive to uncover and nurture the gifts of our students and develop these into talents, hoping to unleash the full extent of their potential across their lifespan. In Australia, the National Assessment Program–Literacy and Numeracy (NAPLAN) plays a controversial role in evaluating student performance and guiding educational policies and practices. However, there exists a contentious belief that NAPLAN data alone can accurately identify high-potential gifted students. In this blog post, I delve into the fallacy of exclusively using NAPLAN data to identify gifted students. 

A Snapshot of NAPLAN

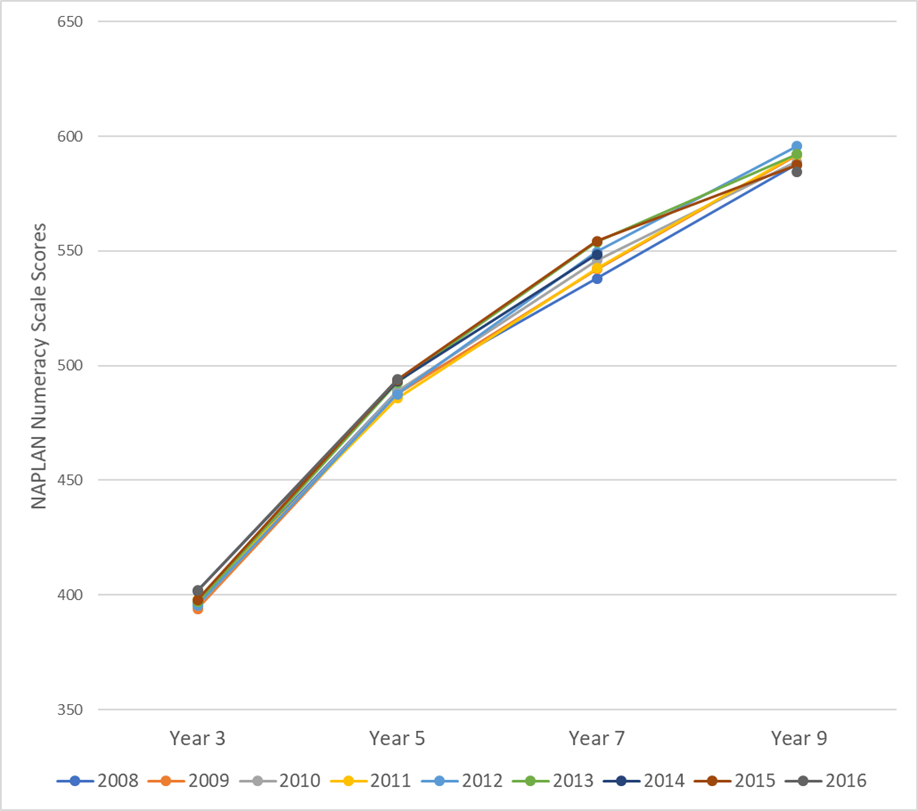
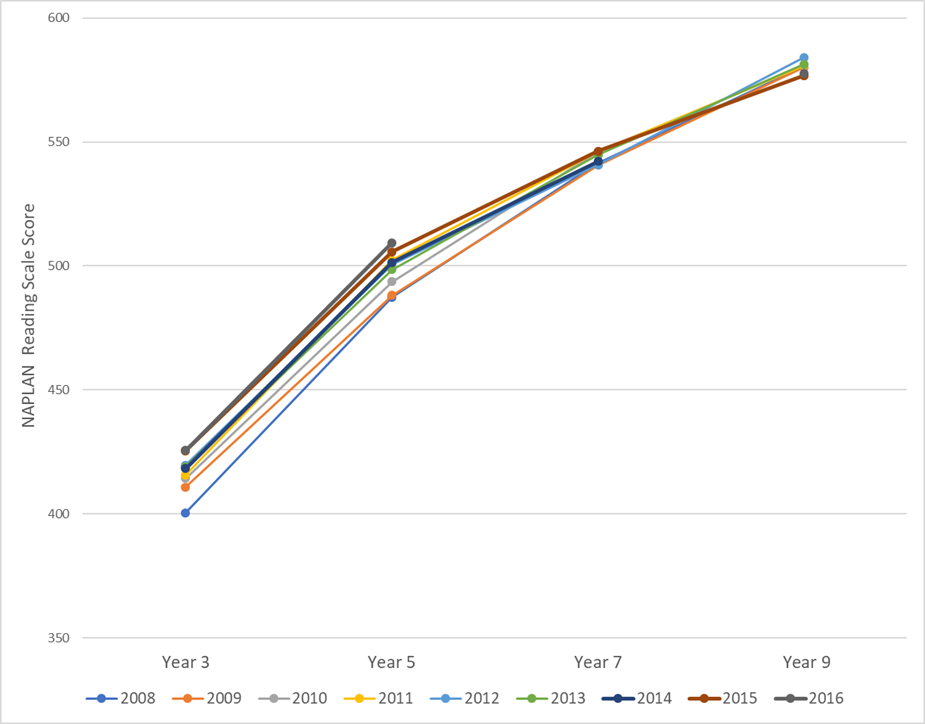
NAPLAN is a nationwide standardised assessment, conducted annually in Australia, designed to assess the proficiency of students in Years 3, 5, 7 and 9, in key learning areas, specifically reading, writing, language conventions, and numeracy. Its main goal is to gauge the effectiveness of the education system and pinpoint areas that may require improvement. NAPLAN was never designed, intended, or validated as a tool to identify giftedness. It was also never designed to make leagues tables for comparing schools.

What is giftedness?

Gifted students typically exhibit advanced cognitive abilities, exceptional problem-solving skills, and have a high capacity for critical thinking. They often demonstrate creativity, strong motivation to learn (in areas of interest), and an insatiable curiosity. In Australia, the terms gifted and talented are often used as synonyms where in fact they have separate meanings. Giftedness is defined using Gagné’s Differentiating Model of Giftedness and Talent (DMGT). In this Model, gifted individuals are understood to have (sometimes as yet unidentified) potential to excel across various domains, including intellectual, (e.g., general intelligence); creative (e.g., problem-solving); social (e.g., leadership); and motor control (e.g., agility).

On the other hand, the Model associates the term talent with performance, accomplishment or achievement, which is outstanding mastery of competencies in a particular field. The term talented is used to only describe individuals who are among the top 10 percent of peers (e.g., leading experts in their field) in any of nine competencies, including academic (e.g., mathematics); technical (e.g., engineering); science and technology (e.g., medical); the arts (e.g., performing); or sports (e.g., athletic talents).

Giftedness seems to be a misunderstood word in Australia. It is often incorrectly construed as referring to people who apparently ‘have it all’, whatever the elusive ‘it’ might be! Anyone who has any experience with giftedness would know that this is an elitist and unrealistic view of gifted learners and indeed, gifted education. In Australian education systems that are based on Gagné’s Model, giftedness focuses on an individual’s potential and ways to foster that potential through programs and practices that support the development of giftedness into talent.

Identifying Giftedness

The quest to identify gifted students has been a long-standing objective for education systems that seek to be genuinely inclusive. Research recommends that we should aim to identify exceptional potential as early as possible, providing tailored education to further nurture abilities. Naturally, the notion of using standardised test data, such as NAPLAN results, can be appealing because of its relative ease of implementation and data generated. But giftedness is not always demonstrated through achievement or performance. Rather, what NAPLAN may identify is some form of talent if we are using Gagné’s definitions.

Giftedness can coexist with other exceptionalities, such as disabilities, where a student is said to be twice-exceptional (or a gifted learner with disability). The twice-exceptionality stems from the two exceptionalities—individuals who are gifted (exceptional potential ) and have coexisting disabilities (e.g., learning, physical, or emotional), and therefore, require unique educational support that addresses both exceptionalities.

Why is Identification Important?

Many students can have their educational needs addressed in a typical classroom, but gifted learners often need specific interventions (e.g., extension, acceleration), or something different (e.g., specific curriculum differentiation), that engages their potential, in areas such as creativity, problem-solving, and curiosity, to develop these natural abilities into competencies and mastery.

There remains a persistent myth that gifted students are so clever that they will always do just fine on their own, without specific support. Yet, we would never expect a gifted tennis player, or a gifted violinist to do “just fine” on their own—the expectation would be for expert, tailored coaching along with extensive opportunities for practice and rehearsal to develop the student’s potential. Coaches focus on the individual needs of the student, rather than a standardised teaching program designed to suit most, but not all. Still, in Australia many claim to have misgivings about introducing anything ‘special’ for gifted students, while not having the same reservations with respect to athletically gifted or musically gifted students.

What Happens if Gifted Learners are Not Supported?

Failing to support the unique needs of gifted students at school can have significant and detrimental consequences on the students and on education systems and societies. Gifted students who are not appropriately challenged and supported may become disengaged and underachieve academically. Some researchers have estimated that 60%-75% of gifted students may be underachieving.

Becoming bored in the classroom can cause disruptive behaviour and a lack of interest in school, leading to problems such as school ‘refusal’ or ‘school can’t’, disengagement and school ‘drop out’ (estimated at up to 40% of gifted students). This perpetuates a cycle of missed opportunities and undeveloped potential. Furthermore, without appropriate support, gifted students may struggle with social and emotional challenges, feeling isolated from their peers because of their unique interests and abilities. This can lead to anxiety, depression, or other mental health issues.

When gifted students are not recognised and supported so that their giftedness can be transformed into talents, they may develop feelings of inadequacy or imposter syndrome. This can lead to decreased self-efficacy and self-confidence. Failing to identify and support gifted students means missing out on nurturing exceptional gifts that deprives the world of potential future leaders, innovators, medical researchers, and change-makers.

Gifted students from diverse backgrounds, including those from underrepresented or disadvantaged groups, may face additional barriers to identification and support. NAPLAN can be particularly problematic as a misused identification tool for underrepresented populations. Neglecting identification, and subsequently neglecting to address gifted students’ unique needs perpetuates inequity.

Societies and education systems that do not embrace inclusion and equity to the full extent risk continuing cycles of exclusion and inadequate support for giftedness. The OECD makes it clear that equity and quality are interconnected, and that improving equity in education should be a high priority. In Australia, priority equity groups never include giftedness or twice-exceptionality, and fail to recognise intersectionality of equity cohorts (e.g., gifted Aboriginal and Torres Strait Islander students), further compounding disadvantage. When schools fail to support gifted students, these learners can become disengaged and leave school prematurely, impacting social wellbeing and economic growth, and representing a missed opportunity for education environments to be truly inclusive. Inclusive education must mean that everyone is included, not everyone except gifted learners.

The Fallacy Unveiled: Limitations of NAPLAN Data to Identify Giftedness

While NAPLAN may have some merits as a standardised assessment tool, problems have been identified and there have even been calls to scrap the tests altogether. So, it is vital to recognise NAPLAN’s limitations, especially concerning the identification of high-potential gifted students. Some key factors that contribute to the fallacy are the narrow assessment scope, because NAPLAN primarily focuses on literacy and numeracy skills. While these are undoubtedly critical foundational skills, they do not encapsulate the full spectrum of giftedness. Moreover, the momentary snapshot provided by NAPLAN of a student’s performance on a particular day may not accurately represent their true capabilities. Factors such as test anxiety, external distractions, or personal issues can significantly impact test outcomes, masking a student’s actual potential.

Giftedness often entails the capacity to handle complexity and to think critically across various domains. Standardised tests like NAPLAN do not effectively measure the multidimensionality of giftedness (from academic precocity, or potential to achieve academically, to creative thinking and problem solving). Relying solely on NAPLAN data to identify gifted students overlooks those who have potential to excel in non-traditional fields or those who possess such unique gifts.

Embracing Comprehensive Identification Practices

To accurately identify and cultivate giftedness, we must embrace a comprehensive and holistic approach for the purpose of promoting inclusive and supportive educational environments, and for developing talent. Using data from multiple sources in identifying giftedness, including both objective and subjective measures (i.e., comprehensive identification) is the gold standard.  

Comprehensive identification practices involve using multiple measures to identify giftedness, with the expectation that appropriate educational support follows. These identification practices should be accessible, equitable, and comprehensive to make sure identification methods are as broad as possible. Comprehensive identification may consist of student portfolios showcasing their projects, psychometric assessment, artwork, essays, or innovative solutions students have devised. This allows educators to gain a deeper understanding of a gifted student’s interests, passions, abilities, and potential.

Additionally, engaging parents, peers, and the student in the identification process can yield valuable perspectives on a student’s unique strengths and gifts, activities and accomplishments, which they may be involved in outside school. This may offer a more well-rounded evaluation. Experienced educators who have completed professional learning in gifted education could play a crucial role in recognising gifted traits in their students. 

By appropriately identifying, recognising, and addressing the needs of gifted students, we can create inclusive and enriched educational settings that foster the development of gifted potential in education environments that are genuinely inclusive.


Michelle Ronksley-Pavia is a Special Education and Inclusive Education lecturer in the School of Education and Professional Studies, and a researcher with the Griffith Institute for Educational Research (GIER), Griffith University. She is an internationally recognised award-winning researcher working in the areas of gifted education, twice-exceptionality (gifted students with disability), inclusive education, learner diversity, and initial teacher education. Her work centres on disability, inclusive educational practices, and gifted and talented educational practices and provisions. 

NAPLAN: Where have we come from – where to from here?

With the shift to a new reporting system and the advice from ACARA that the NAPLAN measurement scale and time series have been reset, now is as good a time as any to rethink what useful insights can be gleaned from a national assessment program.

The 2023 national NAPLAN results were released last week, accompanied by more than the usual fanfare, and an overabundance of misleading news stories. Altering the NAPLAN reporting from ten bands to four proficiency levels, thereby reducing the number of categories students’ results fall into, has caused a reasonable amount of confusion amongst public commentators, and many excuses to again proclaim the demise of the Australian education system. 

Moving NAPLAN to Term 1, with all tests online (except Year 3 writing) seems to have had only minimal impact on the turnaround of results.

The delay between the assessments and the results has been a limitation to the usefulness of the data for schools since NAPLAN began. Added to this, there are compelling arguments that NAPLAN is not a good individual student assessment, shouldn’t be used as an individual diagnostic test, and is probably too far removed from classroom learning to be used as a reliable indicator of which specific teaching methods should be preferred. 

But if NAPLAN isn’t good for identifying individual students’ strengths and weaknesses, thereby informing teacher practices, what is it good for?

My view is that NAPLAN is uniquely powerful in its capacity to track population achievement patterns over time, and can provide good insights into how basic skills develop from childhood through to adolescence. However, it’s important that the methods used to analyse longitudinal data are evaluated and interrogated to ensure that conclusions drawn from these types of analyses are robust and defensible.

Australian governments are increasingly interested in students’ progress at school, rather than just their performance at any one time-point. The second Gonski review (2018) was titled Through Growth to Achievement. In a similar vein, the Alice Springs (Mparntwe) Education Declaration (2019) signed by all state, territory and federal education ministers, argued,

“Literacy and numeracy remain critical and must also be assessed to ensure learning growth is understood, tracked and further supported” (p.13, my italics)

Tracking progress over time should provide information about where students start and how fast they progress, and ideally, allow  insights into whether policy changes at the system or state level have any influence on students’ growth.

However, mandating a population assessment designed to track student growth, does not always translate to consistent information or clear policy directions – particularly when there are so many stakeholders determined to interpret NAPLAN results via their own lens.

One recent example of contradictory information arising from NAPLAN, relates to whether students who start with poor literacy and numeracy results in Year 3 fall further behind as they progress through school. This phenomenon is known as the Matthew Effect. Notwithstanding widespread perceptions that underachieving students make less progress on their literacy and numeracy over their school years compared with higher achieving students, our new research found no evidence of Matthew Effects in NAPLAN data from NSW and Victoria.

In fact, we found the opposite pattern. Students who started with the poorest NAPLAN reading comprehension and numeracy test results in Year 3 had the fastest growth to Year 9. Students who started with the highest achievement largely maintained their position but made less progress.

Our results are opposite to those of an influential Grattan Institute Report published in 2016. This report used NAPLAN data from Victoria and showed that the gap in ‘years of learning’ widened over time. Importantly, this report applied a transformation to NAPLAN data before mapping growth overall, and comparing the achievement of different groups of students.

After the data transformation the Grattan Report found,  

“Low achieving students fall ever further back. Low achievers in Year 3 are an extra year behind high achievers by Year 9. They are two years eight months behind in Year 3, and three years eight months behind by Year 9.” (p.2)

How do we reconcile this finding with our research? My conclusion is that these opposing findings are essentially due to different data analysis decisions.

Without the transformation of data applied in the Grattan Report, the variance in NAPLAN scale scores at the population level decreases between Year 3 and Year 9. This means that there’s less difference between the lowest and highest achieving students in NAPLAN scores by Year 9. Reducing variance over time can be a feature of horizontally-equated Rasch-scaled assessments – and it is a limitation of our research, noted in the paper.

There are other limitations of NAPLAN scores outlined in the Grattan Technical report. These were appropriately acknowledged in the analytic strategy of our paper and include, modelling the decelerating growth curves, accounting for problems with missing data, allowing for heterogeneity in starting point and rate of progress, modelling measurement error, and so on. The latent growth model analytic design that we used is very suited to examining research questions about development, and the type of data generated by NAPLAN assessments.

In my view, the nature of the Rasch scores generated by the NAPLAN testing process does not require a score transformation to model growth in population samples. Rasch scaled scores do not need to be transformed into ‘years of progress’ – and indeed doing so may only muddy the waters.

For example, I don’t think it makes sense to say that a child is at a Year 1 level in reading comprehension based on NAPLAN because the skills that comprise literacy are theoretically different at Year 1 compared with Year 3. We already make a pretty strong assumption with NAPLAN that the tests measure the same theoretical construct from Year 3 to Year 9. Extrapolating outside these boundaries is not something I would recommend.

Nonetheless, the key takeaway from the Grattan report, that “Low achieving students fall ever further back” (p.2) has had far reaching implications. Governments rely on this information when defining the scope of educational reviews (of which there are many), and making recommendations about such things as teacher training (which they do periodically). Indeed, the method proposed by the Grattan report was that used by a recent Productivity Commission report, which subsequently influenced several Federal government education reviews. Other researchers use the data transformation in their own research, when they could use the original scores and interpret standard deviations for group-based comparisons.

Recommendations that are so important at a policy level should really be underpinned by robustly defended data analysis choices. Unfortunately the limitations of an analytic strategy can often be lost because stakeholders want takeaway points not statistical debates. What this example shows is that data analysis decisions can (annoyingly) lead to opposing conclusions about important topics.

Where to from here

Regardless of which interpretation is closer to the reality, NAPLAN 2023 represents something of a new beginning for national assessments in Australia. The key change is that from 2023 the time series for NAPLAN will be reset. This means that schools and states technically should not be comparing this year’s results with previous years. 

The transformation to computer adaptive assessments is also now complete. Ideally this should ensure more precision in assessing the achievement of students at the both ends of the distribution – a limitation of the original paper-based tests. 

Whether the growth patterns observed in the old NAPLAN will remain in the new iteration is not clear: we’ll have to wait until 2029 to replicate our research, when the 2023 Year 3s are in Year 9.  

Sally Larsen is a Lecturer in Learning, Teaching and Inclusive Education at the University of New England. Her research is in the area of reading and maths development across the primary and early secondary school years in Australia, including investigating patterns of growth in NAPLAN assessment data. She is interested in educational measurement and quantitative methods in social and educational research. You can find her on Twitter @SallyLars_27


How this oppressive test is killing the magic of childhood

NAPLAN is taking the fun out of early childhood learning. Early childhood learning encompasses education for children from birth to eight years of age and it is widely known that play-based programs planned with intentionality are the best way for teachers to engage young children in learning. Unfortunately, a focus on NAPLAN scores has resulted in many schools paying more attention to literacy and numeracy programs for children in primary school to perform better in tests in Years 3 and 5. This is impacting on the learning engagement of children in the earlier years. 

Research over decades has shown that play is how young children learn. Through interacting with their environment and their peers, children are making sense of the world and their place in it. These ideals are reflected in the Early Years Learning Framework for Australia that sets out what children aged up to five should be engaging with: “Play-based learning with intentionality can expand children’s thinking and enhance their desire to know and to learn, promoting positive dispositions towards learning” (p.21). The Early Years Learning Framework document applies for all children in the early years of school across Australia, yet the focus on Literacy and Numeracy is narrowing the curriculum and taking away the opportunities for children and teachers to engage in play-based learning.

Although NAPLAN does not happen until Year 3, when children are about 8 years old, it has been identified that teachers in the lower grades are being asked to teach Literacy and Numeracy in more formal ways. The concentrated focus on these two subject areas has led to an increase in the use of whole school commercial programs, some of which are specifically scripted. This practice reduces the autonomy of teachers to make decisions about their teaching based not only on their training but their knowledge of the children in their class. This raises concerns for the teacher and their practice, as well as the engagement of the children through more formalised learning practices earlier in their school experience.

With the publishing of results on the MySchool website and other unintended consequences of the standardised tests, including principal’s performance in some states being measured by these results, NAPLAN has become high stakes. For school leaders, there is pressure to do well, and this is being transferred to teachers and sometimes children and their families which may negatively impact on wellbeing. Even in schools where children traditionally perform well and there are programs focusing on wellbeing, some children are still feeling stressed about doing the tests and what the results will mean for them. This pressure is leading to children doing more formalised learning in literacy and numeracy from an earlier age and ‘play’ is often relegated to Friday afternoons if all other tasks are completed.

Play, or more specifically play-based learning, is often misunderstood within education, despite the evidence of its value. Play is often situated at one end of a continuum with learning at the other when in fact, intentional teachers can implement programs across this continuum to engage children in learning across multiple and integrated subject areas. When children are enjoying their learning through the play, they are often unaware that they are learning science, mathematics, and engineering in the block corner; or geography, history, and science when they are exploring gardening, including investigating how it was done by their grandparents.

Teachers who do not understand play and play-based learning approaches may be uncomfortable with the reduced control that comes through children learning in this way. Research conducted in both the science and technology domains, however, have shown that children often are more engaged and learn more than expected when they are interested in the learning and it is happening in a way that is authentic to their experience. Not only are the children in these research projects learning specific content, but they are also learning Literacy and Numeracy when they plan explorations, calculate results, represent findings, and use technology to create, research, record and share information. The multi-modal options that play facilitates, ensures that all children can feel a sense of accomplishment and can learn from their peers as well as their teacher.

Children do need to be literate and numerate, but NAPLAN scores are not showing improvement despite the increased focus on these two specific learning areas over recent years. At the same time, children are becoming increasingly anxious and disengaged from school from an earlier age. Research in early childhood continues to identify that children engage with and learn through play-based approaches, and through the intentionality of the planning, teachers have autonomy over their programs to suit the needs of the children in their classroom. Perhaps it is time that the fun is brought back to classrooms, not only for children under five but for all children in schools, so that they can engage and enjoy their learning. Engaged children may be less likely to resort to negative behaviour to gain attention, and a reduction in the use of prescribed programs and a little more fun may also help teachers feel valued for their knowledge and expertise. The potential is there for broader approaches and happier children and teachers through increased fun, perhaps helping to bring some teachers back to the workforce – a win all around!

Pauline is a senior lecturer in the Early Childhood program at ECU. Her teaching and research are focused on a range of issues in early childhood education including assessment, curriculum, workforce and reflective practice.

Pausing NAPLAN did not destroy society – but new changes might not fix the future

NAPLAN is again in the news. Last week, it was the Ministers tinkering with NAPLAN reporting and timing. This week it is media league tables ranking schools and sectors, according to NAPLAN results, coinciding with the upload of latest school-level data to the ‘My School’ website. We are now about one month out from the new March test window so expect to hear a lot more in the coming weeks. Many schools will be already deeply into NAPLAN test preparation. 

NAPLAN and My School website were initially introduced by PM Julia Gillard as levers for parental choice. Last week’s ACARA media release reiterates that their primary purpose is so parents can make ‘informed choices’ about their children’s schooling. Media analysis of NAPLAN results correctly identifies what researchers know only too well: that affluence skews educational outcomes to further advantage the already advantaged. 

The Sydney Morning Herald notes that “Public schools with and without opportunity classes, high-fee private institutions and Catholic schools in affluent areas have dominated the top 100 schools…” The reporters are careful to draw attention to a couple of atypical public schools, achieving better results than might be expected from their demographics. A closer look at the SMH table of Top Performing primary schools shows that most low ICSEA public schools ‘punching above their weight’ are very small regional schools. 

No doubt there is a lot to learn from highly effective and usually overlooked small rural schools, but few families can move to them from the city. Parental choice is constrained by income, residential address, work opportunities and a myriad of other factors. In any case, as Stewart Riddle reminds us, what makes a ‘good school’ is far more subtle and complex than anything that a NAPLAN can tell us. 

NAPLAN has gradually morphed into a diagnostic tool for individual students, though there are other tools more fit for this purpose. Notably, the pandemic-induced NAPLAN pause did not lead to the collapse of Australian education but was seen by many teachers as a relief when they were dealing with so many more important aspects of young people’s learning and well-being. 

Education Ministers’ adjustments to NAPLAN indicate that they are at last responding to some of the more trenchant critiques of NAPLAN. The creation of a teacher panel by ACARA as part of the process of setting standards hints that the professional expertise and voices of teachers are valued. Bringing NAPLAN testing forward will hopefully make it more useful where it really matters – in schools and classrooms.

The move to four levels of reporting will be more accessible to parents. Pleasingly, the new descriptor for the lowest quartile – ‘Needs additional support’ – puts the onus on the school and school systems to respond to student needs.

Yet one of the keenest critiques of NAPLAN has not been addressed. There have been widespread calls from educators and academics for the NAPLAN writing test to be withdrawn. It has been found to have a narrowing effect on both the teaching of writing and students’ capacity to write. There is also a whole “how to do NAPLAN” industry of tutors and books pushing formulaic approaches to writing and playing on families’ anxieties.

The failure of the current round of changes to address the NAPLAN writing test leaves students writing like robots. Meanwhile, the release of ChatGPT means that students doing NAPLAN writing for no real purpose or audience of their own are wasting their time. Robots can do it better! These changes needed to map writing better to the National Curriculum, and endorse more meaningful, creative, multimodal and life-relevant writing practices.

 As a single point in time test, NAPLAN has always been just one source of data that teachers and schools can draw upon to design targeted interventions to support student learning. Nevertheless, earlier results will mean that schools will have robust evidence about their need for additional resources. Professional expertise in literacy, numeracy and inclusive education support must be prioritised. 

Parents might be able to resist the inclination to shuffle their children from school to school as a reaction to media headlines, school rankings, and promotional campaigns from the independent sector. Alliances might form between parents and schools to support greater action by state and federal Ministers to address the deeply entrenched divisions that have become baked into Australian schooling.

Attention to NAPLAN continues to mask serious ongoing questions about why Australian governments have created conditions where educational inequities, segregation and stratification are now defining characteristics of our education system. Numerous reports and inquiries have identified flaws and perverse effects from NAPLAN as high stakes testing, especially in relation to the writing test. There is a lot of work yet to be done if NAPLAN is to really be useful and relevant for Australian schools, teachers, parents and learners.

Professor Susanne Gannon is an expert in educational research across a range of domains and methodologies. Much of her research focuses on equity issues in educational policy and practices. Recent research projects include investigations of the impact of NAPLAN on the teaching of writing in secondary school English, young people’s experiences of school closures due to COVID-19 in 2020, and vocational education for students from refugee backgrounds in NSW schools.

Dr Lucinda McKnight is an Australian Research Council Fellow in Deakin University’s Research for Education Impact (REDI) centre. She is undertaking a three year national project examining how the conceptualisation of writing is changing in digital contexts. Follow her Teaching Digital Writing project blog or her twitter account @lucindamcknight8

Header image courtesy of Rory Boon.

The good, the bad and the pretty good actually

Every year headlines proclaim the imminent demise of the nation due to terrible, horrible, very bad NAPLAN results. But if we look at variability and results over time, it’s a bit of a different story.

I must admit, I’m thoroughly sick of NAPLAN reports. What I am most tired of, however, are moral panics about the disastrous state of Australian students’ school achievement that are often unsupported by the data.

A cursory glance at the headlines since NAPLAN 2022 results were released on Monday show several classics in the genre of “picking out something slightly negative to focus on so that the bigger picture is obscured”. 

A few examples (just for fun) include:

Reading standards for year 9 boys at record low, NAPLAN results show 

Written off: NAPLAN results expose where Queensland students are behind 

NAPLAN results show no overall decline in learning, but 2 per cent drop in participation levels an ‘issue of concern’ 

And my favourite (and a classic of the “yes, but” genre of tabloid reporting)

‘Mixed bag’ as Victorian students slip in numeracy, grammar and spelling in NAPLAN 

The latter contains the alarming news that “In Victoria, year 9 spelling slipped compared with last year from an average NAPLAN score of 579.7 to 576.7, but showed little change compared with 2008 (576.9). Year 5 grammar had a “substantial decrease” from average scores of 502.6 to 498.8.”

If you’re paying attention to the numbers, not just the hyperbole, you’ll notice that these ‘slips’ are in the order of 3 scale scores (Year 9 spelling) and 3.8 scale scores (Year 5 grammar). Perhaps the journalists are unaware that the NAPLAN scale ranges from 1-1000? It might be argued that a change in the mean of 3 scale scores is essentially what you get with normal fluctuations due to sampling variation – not, interestingly, a “substantial decrease”. 

The same might be said of the ‘record low’ reading scores for Year 9 boys. The alarm is caused by a 0.2 score difference between 2021 and 2022. When compared with the 2008 average for Year 9 boys the difference is 6 scale score points, but this difference is not noted in the 2022 NAPLAN Report as being ‘statistically significant’ – nor are many of the changes up or down in means or in percentages of students at or above the national minimum standard.

Even if differences are reported as statistically significant, it is important to note two things: 

1. Because we are ostensibly collecting data on the entire population, it’s arguable whether we should be using statistical significance at all.

2. As sample sizes increase, even very small differences can be “statistically significant” even if they are not practically meaningful.

Figure 1. NAPLAN Numeracy test mean scale scores for nine cohorts of students at Year 3, 5, 7 and 9.

The practical implications of reported differences in NAPLAN results from year to year (essentially the effect sizes) are not often canvassed in media reporting. This is an unfortunate omission and tends to enable narratives of largescale decline, particularly because the downward changes are trumpeted loudly while the positives are roundly ignored. 

The NAPLAN reports themselves do identify differences in terms of effect sizes – although the reasoning behind what magnitude delineates a ‘substantial difference’ in NAPLAN scale scores is not clearly explained. Nonetheless, moving the focus to a consideration of practical significance helps us ask: If an average score changes from year to year, or between groups, are the sizes of the differences something we should collectively be worried about? 

Interestingly, Australian students’ literacy and numeracy results have remained remarkably stable over the last 14 years. Figures 1 and 2 show the national mean scores for numeracy and reading for the nine cohorts of students who have completed the four NAPLAN years, starting in 2008 (notwithstanding the gap in 2020). There have been no precipitous declines, no stunning advances. Average scores tend to move around a little bit from year to year, but again, this may be due to sampling variability – we are, after all, comparing different groups of students. 

This is an important point for school leaders to remember too: even if schools track and interpret mean NAPLAN results each year, we would expect those mean scores to go up and down a little bit over each test occasion. The trick is to identify when an increase or decrease is more than what should be expected, given that we’re almost always comparing different groups of students (relatedly see Kraft, 2019 for an excellent discussion of interpreting effect sizes in education). 

Figure 2. NAPLAN Reading test mean scale scores for nine cohorts of students at Year 3, 5, 7 and 9.

Plotting the data in this way it seems evident to me that, since 2008, teachers have been doing their work of teaching, and students by-and-large have been progressing in their skills as they grow up, go to school and sit their tests in years 3, 5, 7 and 9. It’s actually a pretty good news story – notably not an ongoing and major disaster. 

Another way of looking at the data, and one that I think is much more interesting – and instructive – is to consider the variability in achievement between observed groups. This can help us see that just because one group has a lower average score than another group, this does not mean that all the students in the lower average group are doomed to failure.

Figure 3 shows just one example: the NAPLAN reading test scores of a random sample of 5000 Year 9 students who sat the test in NSW in 2018 (this subsample was randomly selected from data for the full cohort of students in that year, N=88,958). The red dots represent the mean score for boys (left) and girls (right). You can see that girls did better than boys on average. However, the distribution of scores is wide and almost completely overlaps (the grey dots for boys and the blue dots for girls). There are more boys at the very bottom of the distribution and a few more girls right at the top of the distribution, but these data don’t suggest to me that we should go into full panic mode that there’s a ‘huge literacy gap’ for Year 9 boys. We don’t currently have access to the raw data for 2022, but it’s unlikely that the distributions would look much different for the 2022 results.  

Figure 3. Individual scale scores and means for Reading for Year 9 boys and girls (NSW, 2018 data).

So what’s my point? Well, since NAPLAN testing is here to stay, I think we can do a lot better on at least two things: 1) reporting the data honestly (even when its not bad news), and 2) critiquing misleading or inaccurate reporting by pointing out errors of interpretation or overreach. These two aims require a level of analysis that goes beyond mean score comparisons to look more carefully at longitudinal trends (a key strength of the national assessment program) and variability across the distributions of achievement.

If you look at the data over time NAPLAN isn’t a story of a long, slow decline. In fact, it’s a story of stability and improvement. For example, I’m not sure that anyone has reported that the percentage of Indigenous students at or above the minimum standard for reading in Year 3 has stayed pretty stable since 2019 – at around 83% up from 68% in 2008. In Year 5 it’s the highest it’s ever been at 78.5% of Indigenous students at or above the minimum standard – up from 63% in 2008. 

Overall the 2022 NAPLAN report shows some slight declines, but also some improvements, and a lot that has remained pretty stable. 

As any teacher or school leader will tell you, improving students’ basic skills achievement is difficult, intensive and long-term work. Like any task worth undertaking, there will be victories and setbacks along the way. Any successes should not be overshadowed by the disaster narratives continually fostered by the 24/7 news cycle. At the same time, overinterpreting small average fluctuations doesn’t help either. Fostering a more nuanced and longer-term view when interpreting NAPLAN data, and recalling that it gives us a fairly one-dimensional view of student achievement and academic development would be a good place to start.

Sally Larsen is a Lecturer in Learning, Teaching and Inclusive Education at the University of New England. Her research is in the area of reading and maths development across the primary and early secondary school years in Australia, including investigating patterns of growth in NAPLAN assessment data. She is interested in educational measurement and quantitative methods in social and educational research. You can find her on Twitter @SallyLars_27

AERO’s writing report is causing panic. It’s wrong. Here’s why.

If ever there was a time to question public investment in developing reports using  ‘data’ generated by the National Assessment Program, it is now with the release of the Australian Educational Research Organisation’s report ‘Writing development: What does a decade of NAPLAN data reveal?’ 

I am sure the report was meant to provide reliable diagnostic analysis for improving the function of schools. 

It doesn’t. Here’s why.

There are deeply concerning technical questions about both the testing regime which generated the data used in the current report, and the functioning of the newly created (and arguably redundant) office which produced this report.

There are two lines of technical concern which need to be noted. These concerns reveal reasons why this report should be disregarded – and why media response is a beatup.

The first technical concern for all reports of NAPLAN data (and any large scale survey or testing data) is how to represent the inherent fuzziness of estimates generated by this testing apparatus.  

Politicians and almost anyone outside of the very narrow fields reliant on educational measurement would like to talk about these numbers as if they are definitive and certain.

They are not. They are just estimates – but all of the summary statistics reports are just estimates.  

The fact these are estimates is not apparent in the current report.  There is NO presentation of any of the estimates of error in the data used in this report. 

Sampling error is important, and, as ACARA itself has noted, (see, eg, the 2018 NAPLAN technical report) must be taken into account when comparing the different samples used for analyses of NAPLAN.  This form of error is the estimate used to generate confidence intervals and calculations of ‘statistical difference’.  

Readers who recall seeing survey results or polling estimates being represented with a ‘plus or minus’ range will recognise sampling error. 

Sampling error is a measure of the probability of getting a similar result if the same analyses were done again, with a new sample of the same size, with the same instruments, etc.  (I probably should point out that the very common way of expressing statistical confidence often gets this wrong – when we say we have X level of statistical confidence, that isn’t a percentage of how confident you can be with that number, but rather the likelihood of getting a similar result if you did it again.)  

In this case, we know about 10% of the population do not sit the NAPLAN writing exam, so we already know there is sampling error.  

This is also the case when trying to infer something about an entire school from the results of a couple of year levels.  The problem here is that we know the sampling error introduced by test absences is not random and accounting for it can very much change trend analyses, especially for sub-populations So, what does this persuasive writing report say about sampling error? 

Nothing. Nada. Zilch. Zero. 

Anyone who knows basic statistics knows that when you have very large samples, the amount of error is far less than with smaller samples.  In fact, with samples as large as we get in NAPLAN reports, it would take only a very small difference to create enough ripples in the data to show up as being statistically significant.  That doesn’t mean, however, the error introduced is zero – and THAT error must be reported when representing mean differences between different groups (or different measures of the same group).

Given the size of the sampling here, you might think it ok to let that slide.  However, that isn’t the only short cut taken in the report.  The second most obvious measure ignored in this report is measurement error.  Measurement error exists any time we create some instrument to estimate a ‘latent’ variable – ie something you can’t see directly.  We can’t SEE achievement directly – it is an inference based on measuring several things we can theoretically argue are valid indicators of that thing we want to measure.  

Measurement error is by no means a simple issue but directly impacts the validity of any one individual student’s NAPLAN score and an aggregate based on those individual results.  In ‘classical test theory’ a measured score is made of up what is called a ‘true score’ and error (+/-).  In more modern measurement theories error can become much more complicated to estimate, but the general conception remains the same.  Any parent who has looked at NAPLAN results for their child and queried whether or not the test is accurate is implicitly questioning measurement error.

Educational testing advocates have developed many very mathematically complicated ways of dealing with measurement error – and have developed new testing techniques for improving their tests.  The current push for adaptive testing is precisely one of those developments, in the local case being rationalised as adaptive testing (where which specific test item is asked of the person being tested changes depending on prior answers) does a better job of differentiation those at the top and bottom end of the scoring range (see the 2019 NAPLAN technical report for this analysis). 

 This bottom/top of the range problem is referred to as a floor or ceiling effect.  When large proportion of students either don’t score anything or get everything correct, there is no way to differentiate those students from each other – adaptive testing is a way of dealing with floor and ceiling effects better than a predetermined set of test items.  This adaptive testing has been included in the newer deliveries of the online form of the NAPLAN test.

Two important things to note. 

One, the current report claims the performance of high ‘performing’ students’ scores has shifted down – despite new adaptive testing regimes obtaining very different patterns of ceiling effect. Second, the test is not identical for all students (they never have been).  

The process used for selecting test items  is based on ‘credit models’ generated by testers. Test items are determined to have particular levels of ‘difficulty’ based on the probability of correct answers being given from different populations and samples, after assuming population level equivalence in prior ‘ability’ AND creating difficulties score for items while assuming individual student ‘ability’ measures are stable from one time period to the next.  That’s how they can create these 800 point scales that are designed for comparing different year levels.

So what does this report say about any measurement error that may impact the comparisons they are making?  Nothing.

One of the ways ACARA and politicians have settled their worries about such technical concerns as accurately interpreting statistical reports is by introducing the reporting of test results in ‘Bands’.  Now these bands are crucial for qualitatively describing rough ranges of what the number might means in curriculum terms – but they come with a big consequence.  Using ‘Band’ scores is known as ‘coarsening’ data – when you take a more detailed scale and summarise it in a smaller set of ordered categories – and that process is known to increase any estimates of error.  This later problem has received much attention in the statistical literature, with new procedures being recommended for how to adjust estimates to account for that error when conducting group comparisons using that data.  

As before, the amount of reporting of that error issue? Nada.

 This measurement problem is not something you can ignore – and yet the current report is worse than careless on this question.

It takes advantage of readers not knowing about it. 

When the report attempts to diagnose which component of the persuasive writing tasks were of most concern, it does not bother reporting that the error for each of the separate measures of those ten dimensions of writing has far more error than the total writing score, simply because the number of marks for each is a fraction of the total.  The smaller the number of indicators, the more error (and less reliability).

Now all of these technical concerns simply raises the question of whether or not the overall findings of the report will hold up to robust tests and rigorous analysis – there is no way to assess that from this report, but there is even bigger reason to question why it was given as much attention as it was.  That is, for any statistician, there is always a challenge to translate the numeric conclusions into some for of ‘real life’ scenario.

To explain why AERO has significantly dropped the ball on this last point, consider its headline claim that year 9 students have had declining persuasive writing scores and somehow representing that as a major new concern.  

First note that the ONLY reporting of this using the actual scale values is a vaguely labelled line graph showing scores from 2011 until 2018 – skipping 2016 since the writing task that year wasn’t for persuasive writing (p 26 of the report has this graph).  Of those year to year shifts, the only two that may be statistically significant, and are readily visible, are from 2011 to 2012, and then again from 2017 to 2018.  Why speak so vaguely? From the report, we can’t tell you the numeric value of that drop, because there is no reporting of the actual number represented in that line graph.  

Here is where the final reality check comes in.  

If this data matches the data reported in the national reports from 2011 and 2018, the named mean values on the writing scale were 565.9 and 542.9 respectively.  So that is a drop between those two time points of 23 points.  That may sound like a concern, but recall those scores are based on 48 marks given for writing.  In other words, that 23 point difference is no more than one mark difference (it could be far less since each different mark carries a different weighting in formulation that 800 scale).  

Consequently, even if all the technical concerns get sufficient address and the pattern still holds, the realistic title of Year 9 claim would be ‘Year 9 students in 2018 NAPLAN writing test scored one less mark than the Year 9 students of 2011.’

Now assuming that 23 point difference has anything to do with the students at all, start thinking about all the plausible reasons why students in that last year of NAPLAN may not have been as attentive to details as they were when NAPLAN was first getting started.   I can think of several, not least being the way my own kids did everything possible to ignore the Year 9 test – since the Year 9 test had zero consequences for them.  

Personally, these reports are troubling for many reasons, inclusive of the use of statistics to assert certainty without good justification, but also because saying student writing has declined belies that obvious fact that is hasn’t been all that great for decades.  This is where I am totally sympathetic to the issues raised by the report – we do need better writing among the general population.  But using national data to produce a report of this calibre, by an agency beholden to government, really does little more than provide click-bait and knee jerk diagnosis from all sides of a debates we don’t really need to have.

James Ladwig is Associate Professor in the School of Education at the University of Newcastle.  He is internationally recognised for his expertise in educational research and school reform.  Find James’ latest work in Limits to Evidence-Based Learning of Educational Science, in Hall, Quinn and Gollnick (Eds) The Wiley Handbook of Teaching and Learning published by Wiley-Blackwell, New York. James is on Twitter @jgladwig

AERO’s response to this post

ADDITIONAL COMMENTS FROM AERO provided on November 9: information about the statistical issues discussed, a more detailed Technical Note is available at AERO.

On Monday, EduResearch Matters published the above post by Associate Professor James Ladwig which critiqued the Australian Education Research Office’s Writing development: what does a decade of NAPLAN data reveal? 

AERO’s response is below, with additional comments from Associate Professor Ladwig. 

AERO: This article makes three key criticisms about the analysis presented in the AERO report, which are inaccurate.

Ladwig claims that the report lacks consideration of sampling error and measurement error in its analysis of the trends of the writing scores. In fact, those errors were accounted for in the complex statistical method applied. AERO’s analysis used both simple and complex statistical methods to examine the trends. While the simple method did not consider error, the more complex statistical method (referred to as the ‘Differential Item Analysis’) explicitly considered a range of errors (including measurement error, and cohort and prompt effects).

Associate Professor Ladwig: AERO did not include any of that in its report nor in any of the technical papers. There is no overtime DIF analysis of the full score – and I wouldn’t expect one.  All of the DIF analyses rely on data that itself carries error (more below). There is no way for the educated reader to verify these claims without expanded and detailed reporting of the technical work underpinning this report. This is lacking in transparency, falls shorts of the standards we should expect from AERO and makes it impossible for AERO to be held accountable for its specific interpretation of their own results.

AERO: Criticism of the perceived lack of consideration of ‘ceiling effects’ in AERO’s analysis of the trends of high-performing students’ results, omits the fact that AERO’s analysis focused on the criteria scores (not the scaled measurement scores). AERO used the proportion of students achieving the top 2 scores (not the top score), for each criterion, as the matrix to examine the trends. Given only a small proportion of students achieved a top score for any criterion (as shown in the report statistics), there is no ‘ceiling effect’ that could have biased the interpretation of the trends.

Associate Professor Ladwig made his ‘ceiling effect’ comments while explaining how the NAPLAN writing scores are designed not in relation to the AERO analysis.

AERO: The third major inaccuracy relates to the comments made about the ‘measurement error’ around the NAPLAN bands and the use of adaptive testing to reduce error. These are irrelevant to AERO’s analysis because the main analysis did not use scaled scores, it did not use bands, and adaptive testing is not applicable to the writing assessment.

Associate Professor Ladwig’s comment was about the scaling in relation to explaining the score development, not about the AERO analysis.

In relation to the AERO use of NAPLAN criterion score data in the writing analysis, however, please note that those scores are created either through scorer moderation processes or (increasingly where possible) text interpretative algorithms.  Here again the address of the reliability of these raw scores was absent, but with one declared limitation noted, in AERO’s own terms:

Another key assumption underlying most of the interpretation of results in this report is that marker effects (that is, marking inconsistency across years) are small and therefore they do not impact on the comparability of raw scores over time. (p[.66)

This is where AERO has taken another short cut, with an assumption that should not be made.  ACARA has reported the reliability estimates to include that in the scores analysis.  It is readily possible to report those and use them for trend analyses.

AERO: A final point: the mixed-methods design of the research was not recognised in the article. AERO’s analysis examined the skills students were able to achieve at the criterion level against curriculum documents. Given the assessment is underpinned by a theory of language, we were able to complement quantitative with a qualitative analysis that specifically highlighted the features of language students were able to achieve. This was validated by analysis of student writing scripts.

Associate Professor Ladwig says this is irrelevant to his analysis. The logic of this is also a concern. Using multiple methods and methodologies does not correct for any that are technically lacking.  In relation to the overall point of concern, we have a clear example of an agency reporting statistical results in a manner that elides external scrutiny accompanied by an extreme media positioning. Any of the qualitative insights to the minutia these numbers represent will probably very useful for teachers of writing – but whether or not they are generalisable, big, or shifting depends on those statistical analysis themselves. 

Is the NAPLAN results delay about politics or precision?

The decision announced yesterday by ACARA to delay the release of preliminary NAPLAN data is perplexing. The justification is that the combination of concerns around the impact of COVID-19 on children, and the significant flooding that occurred across parts of Australia in early 2022 contributed to many parents deciding to opt their children out of participating in NAPLAN. The official account explains:

“The NAPLAN 2022 results detailing the long-term national and jurisdictional trends will be released towards the end of the year as usual, but there will be no preliminary results release in August this year as closer analysis is required due to lower than usual student participation rates as a result of the pandemic, flu and floods.”

The media release goes on to say that this decision will not affect the release of results to schools and to parents, which have historically occurred at similar times of the year. The question that this poses, of course, is why the preliminary reporting of results is affected, but student and school reports will not be. The answer is likely to do with the nature of the non-participation. 

The most perplexing part of this decision is that NAPLAN has regularly had participation rates below 90% at various times among various cohorts. That has never prevented preliminary results being released before.

What are the preliminary results?

Since 2008, NAPLAN has been a controversial feature of the Australian school calendar for students in Years 3, 5, 7 and 9. The ‘pencil-and-paper’ version of NAPLAN was criticised for how statistical error impacts its precision at the student and school level (Wu, 2016), the impact that NAPLAN has had on teaching and learning (Hardy, 2014), and the time it takes for the results to come back (Thompson, 2013). Since 2018, NAPLAN has gradually shifted to an online, adaptive design which ACARA claims “are better targeted to students’ achievement levels and response styles meaning that the tests “provide more efficient and precise estimates of students’ achievements than do fixed form paper based tests. 2022 was the first year that the tests were fully online. 

NAPLAN essentially comprises four levels of reporting. These are student reports, school level reports, preliminary national reports and national reports. The preliminary reports are usually released around the same time as the student and school results. They report on broad national and sub-national trends, including average results for each year level in each domain across each state and territory and nationally. Closer to the end of the year, a National Report is released which contains deeper analysis on how characteristics such as gender, Indigenous status, language background other than English status, parental occupation, parental education, and geolocation impact achievement at each year level in each test domain.

Participation rates

The justification given in the media release concerns participation rates. To understand this better, we need to understand how participation impacts the reliability of test data and the validity of inferences that can be made as a result (Thompson, Adie & Klenowski, 2018). NAPLAN is a census test. This means that in a perfect world, all students in Years 3, 5, 7 & 9 would sit their respective tests. Of course, 100% participation is highly unlikely, so ACARA sets a benchmark of 90% for participation. Their argument is that if 90% of any given cohort sits a test we can be confident that the results of those sitting the tests are representative of the patterns of achievement of the entire population, even sub-groups within that population. ACARA calculates the participation rate as “all students assessed, non-attempt and exempt students as a percentage of the total number of students in the year level”. Non-attempt students are those who were present but either refused to sit the test or did not provide sufficient information to estimate an achievement score. Exempt students are those exempt from  one or more of the tests on the grounds of English language proficiency or disability.

The challenge, of course, is that non-participation introduces error into the calculation of student achievement. Error is a feature of standardised testing, it doesn’t mean mistakes in the test itself, it rather is an estimation of the various ways that uncertainty emerges in predicting how proficient a student is in an entire domain based on a relatively small sample of questions that make up a test. The greater the error, the less precise (ie less reliable) the tests are. With regards to participation, the greater the non-participation, the more uncertainty is introduced into that prediction. 

The confusing thing in this decision is that NAPLAN has regularly had participation rates below 90% at various times among various cohorts. This participation data can be accessed here.  For example, in 2021 the average participation rates for Year 9 students were slightly below the 90% threshold in every domain yet this did not impact the release of the Preliminary Report. 

Table 1: Year 9 Participation in NAPLAN 2021 (generated from ACARA data)

These 2021 results are not an anomaly, they are a trend that has emerged over time. For example, in pre-pandemic 2018 the jurisdictions of Queensland, South Australia, ACT and Northern Territory did not reach the 90% threshold in any of the Year 9 domains. 

Table 2: Year 9 Participation in NAPLAN 2018 (generated from ACARA data)

Given these results above, the question remains why has participation affected the reporting of the 2022 results, but Year 9 results in 2018, or 2021, were not similarly affected?

At the outset, I am going to say that there is a degree of speculation in answering this question. Primarily, this is because even if participation declines to 85%, this is still a very large sample with which to predict the achievement of the population in a given domain, so it must be that something has not worked when they have tried to model the data. I am going to suggest three possible reasons:

  1. The first is likely, given that it is hinted at in the ACARA press release. If we return to the relationship between participation, error and the validity of inferences, the most likely way that an 85% participation rate could be a problem is if non-participation is not randomly spread across the population. If non-participation was shown to be systematic, that is it is heavily biassed to particular subgroups, then depending upon the size of that bias, the ability to make valid inferences about achievement in different jurisdictions or amongst different sub-groups could be severely impacted. One effect of this is that it might become difficult to reliably equate 2022 results with previous years. This could explain why lower than 90% Year 9 participation in 2021 was not a problem – the non-participation was relatively randomly spread across the sub-groups.
  2. Second, and related to the above, is that the non-participation has something to do with the material and infrastructural requirements for an online test that is administered to all students across Australia. There have long been concerns about the infrastructure requirements of NAPLAN online such as access to computers, reliable internet connections and so on particularly in regional and remote areas of Australia. If these were to influence results, such as through an increased number of students unable to attempt the test, this could also influence the reliability of inferences amongst particular sub-groups. 
  3. The final possibility is political. It has been obvious for some time that various Education Ministers have become frustrated with aspects of the NAPLAN program. The most prominent example of this was the concern expressed by the Victorian Education Minister in 2018 about the reliability of the equation of the online and paper tests. (Education chiefs have botched Naplan online test, says Victoria minister | Australian education | The Guardian) During 2018, ACARA were criticised for showing a lack of responsible leadership in releasing results that seemed to show a mode effect, that is, a difference between students that sat the online vs the pen and paper test not related to their capacity in literacy and numeracy. It may be that ACARA has grown cautious as a result of the 2018 ministerial backlash and feel that any potential problems with the data need to be thoroughly investigated before jurisdictions are named and shamed based on their average scores. 

Ultimately, this leads us to perhaps one of the more frustrating things, we may never know. Where problems emerge around NAPLAN, the tendency is for ACARA and/or the Federal Education Minister to whom ACARA reports, to try to limit criticism by denying access to the data. In 2018, at the height of the controversy of the differences between the online and pencil and paper modes, I formed a team with two internationally eminent psychometricians to research whether there was a mode effect between the online and pencil and paper versions of NAPLAN. The request to ACARA to access the dataset was denied with the words that ACARA could not release item level data for the 2018 online items, presumably because they were provided by commercial entities. In the end, we just have to trust ACARA that there was not one. If we have learnt anything from recent political scandals, perfect opaqueness remains a problematic governance strategy.

Greg Thompson is a professor in the Faculty of Creative Industries, Education & Social Justice at the Queensland University of Technology. His research focuses on the philosophy of education and educational theory. He is also interested in education policy, and the philosophy/sociology of education assessment and measurement with a focus on large-scale testing and learning analytics/big data.

Why appeasing Latham won’t make our students any more remarkable

Are our schools making the kids we think we should? The tussle between politics and education continues and Latham is just the blunt end of what is now the assumed modus operandi of school policy in Australia. 

Many readers of this blog no doubt will have noticed a fair amount of public educational discussion about NSW’s School Success Model (SSM) which, according to the Department flyer, is ostensibly new. For background NSW context, it is important to note that this policy was released in the context of a new Minister for Education who has openly challenged educators to ‘be more accountable’, alongside of an entire set of parliamentary educational inquiries set up to appease Mark Latham, who chairs a portfolio committee with a very clear agenda motivated by the populism of his political constituency.  

This matters because there are two specific logics used in the political arena that have been shifted into the criticisms of schools: the public dissatisfaction leading to accountability question (so there’s a ‘public good’ ideal somewhere behind this), and the general rejection of authorities and elitism (alternatively easily labelled anti-intellectualism.)  Both of these political concerns are connected to the School Success Model.  The public dissatisfaction is motivating the desire for measures of accountability that the public believes can be free of tampering, and ‘matter’.  Test scores dictating students’ futures, so they matter, etc. The rejection of elitism is also embedded in the accountability issue. That is due to a (not always unwarranted) lack of trust.  That lack of trust often gets openly directed to specific people

Given the context, while the new School Success Model (SSM) is certainly well intended, it also represents one of the more direct links between politics and education we typically see.  The ministerialisation of schooling is clearly alive and well in Australia.  This isn’t the first time we have seen such direct links – the politics of NAPLAN was, afterall, straight from the political intents of its creators.  It is important to note that the logic at play has been used by both major parties in government.  Implied in that observation is that the systems we have live well beyond election cycles.

Now in this case, the basic political issues how to ‘make’ schools rightfully accountable, and at the same time push for improvement. I suspect this are at least popular sentiments, if not overwhelmingly accepted as a given by the vast majority of the public.  So alongside from general commitments to ‘delivering support where it is needed, and ‘learning from the past’, the model is most notable for it main driver – a matrix of measures ‘outcome’ targets.  In the public document that includes targets are the systems level and school level – aligned.  NAPLAN, Aboriginal Education, HCS, Attendance, Students growth (equity), and Pathways are the main areas specified for naming targets.

But, like many of the other systems created with the same good intent before it, this one really does invite the growing criticism already noted in public commentary. Since, with luck, public debate will continue, here I would like to put some broader historical context to these debates, take a look under the hood of these measures to show why they really aren’t fit for purpose for school accountability purposes without far more sophisticated understanding of what they can and can not tell you.

In the process of walking through some of this groundwork, I hope to show why the main problem here is not something a reform here or there will change.  The systems are producing pretty much what they are designed to do.  

On the origins of this form of governance

Anyone who has studied the history of schooling and education (shockingly few in the field these days) would immediately see the target-setting agenda as a ramped up version of scientific-management (see Callaghan, 1962), blended with a bit of Michael Barber’s methodology for running government (Barber, 2015), using contemporary measurements.

More recently, at least since the then labelled ‘economic rationalist’ radical changes brought to the Australia public services and government structures in the late 1980s and early 1990s, the notion of measuring outcomes of schools as a performance issue has matured, in tandem with the past few decades of an increasing dominance of the testing industry (which also grew throughout the 20th century). The central architecture of this governance model would be called neo-liberal these days, but it is basically a centralised ranking system based on pre-defined measures determined by a select few, and those measures are designed to be palatable to the public.  Using such systems to instil a bit of group competition between schools fits very well with those who believe market logic works for schooling, or those who like sport.

The other way of motivating personnel in such systems is, of course, mandate, such as the now mandated Phonic Screening Check announce in the flyer.

The devil in details

Now when it comes to school measures, there are many types we actually know a fair amount about most if not all of them – as most are generated from research somewhere along the way. There are some problems of interpretation that all school measures face which relate the basic problem that most measures are actually measures of individuals (and not the school), or vice-versa.  Relatedly, we also often see school level measures which are simply the aggregate of the individuals.  In all of these cases, there are many good intentions that don’t match reality.

For example, it isn’t hard to make a case for saying schools should measure student attendance.  The logic here is that students have to be at school to learn school things (aka achievement tests of some sort). You can simply aggregate individual students attendance to the school level and report it publicly (as on MySchool), because students need to be in school. But it would be a very big mistake to assume that the school level aggregated mean attendance of the student data is at all related to school level achievement.  It is often the case that what is true for individual, is also not true for the collective in which the individual belongs.  Another case in point here is policy argument that we need expanded educational attainment (which is ‘how long you stay in schooling’) because if more people get more education, that will bolster the general economy.  Nationally that is a highly debatable proposition (among OECD countries there isn’t even a significant correlation between average educational attainment and GDP).  Individually it does make sense – educational attainment and personal income, or individual status attainment is generally quite positively related.  School level attendance measures that are simple aggregates are not related to school achievement (Ladwig and Luke, 2011).  This may be why the current articulation attendance target is a percentage of students attending more than 90% of the time (surely a better articulation than a simple average – but still an aggregate of untested effect).  The point is more direct – often these targets are motivated by an goal that has been based on some causal idea – but the actually measures often don’t reflect that idea directly.

Another general problem, especially for the achievement data, is the degree to which all of the national (and state) measures are in fact estimates, designed to serve specific purposed.   The degree to which this is true varies from test to test.   Almost all design options in assessment systems carry trade offs.  There is a big difference between an HSC score – where the HSC exams and syllabuses are very closely aligned and the student performance is designed to reflect that; as opposed to NAPLAN, which is designed to not be directly related to syllabuses but overtly as a measure designed to estimate achievement on an underlying scale that is derived from the populations.  For HSC scores, it makes some sense to set targets but notice those targets come in the forms of percentage of students in a given ‘Band.’

Now these bands are tidy and no doubt intended to make interpretation of results easier for parents (that’s the official rational). However, both HSC Bands and NAPLAN bands represent ‘coarsened’ data.  Which means that they are calculated on the basis of some more finely measured scale (HSC raw scores, NAPLAN scale scores).  There are two known problems with coarsened data: 1) in general they increase measurement error (almost by definition), and 2) they are not static overtime.  Of these two systems, the HSC would be much more stable overtime, but even there much development occurs overtime, and the actual qualitative descriptors of the bands changes as syllabuses are modified.  So these band scores, and the number of students in each, is something that really needs to understood to be very less precise than counting kids in those categories implies. For more explanation and an example of one school which decides to change its spelling programs on the basis of needing one student to get one more item test correct, in order for them to meet their goal of having a given percentage of students in a given band, (see Ladwig, 2018).

There is a lot of detail behind this general description, but the point is made very clearly in the technical reports, such as when ACARA shifted how it calibrated its 2013 results relative to previous test years – where you find the technical report explaining that ACARA would need to stop assuming previous scaling samples were ‘secure’.  New scaling samples are drawn each year since 2013. When explaining why they needed to estimate sampling error in a test that was given to all students in a given year, ACARA was forthright and made it very clear: 

‘However, the aim of NAPLAN is to make inference about the educational systems each year and not about the specific student cohorts in 2013’ (p24).

Here you can see overtly that the test was NOT designed for the purposes to which the NSW Minister wishes to pursue.  

The slippage between any credential (or measure) and what it is supposed to represent has a couple of names.  When it comes to testing and achievement measurements, it’s called error.  There’s a margin within which we can be confident, so analysis of any of that data requires a lot of judgement, best made by people who know what and who is being measured.  But that judgement can not be exercised well without a lot of background knowledge that is not typically in the extensive catalogue of background knowledge needed by school leaders.

At a system level, the slippage between what’s counted and what it actually means is called decoupling.  And any of the new school level targets are ripe for such slippage.  Numbers of Aboriginal students obtaining an HSC is clear enough – but does it reflect the increasing numbers of alternative pathways used by an increasingly wide array of institutions? Counting how many kids continue to Year 12 make sense, but it also is motivation for schools to count kids simply for that purpose. 

In short, while the public critics have spotted potential perverse unintended consequence, I would hazard a prediction that they’ve just covered the surface.  Australia already has ample evidence of NAPLAN results being used as the based of KPI development with significant problematic side effects – there is no reason to think this would be immune from misuse, and in fact invites more (see Mockler and Stacey, 2021).

The challenge we need to take is not how to make schools ‘perform’ better or teachers ‘teach better’ – any of those a well intended, but this is a good time to point out common sense really isn’t sensible once you understand how the systems work.  To me it is the wrong question to ask how we make this or that part of the system do something more or better.

In this case, it’s a question of how can we build systems in which school and teachers are rightfully and fairly accountable and in which schools, educators, students are all growing.  And THAT question can not reached until Australia opens up bigger questions about curriculum that have been locked into what has been a remarkable resilience structure ever since the early 1990s attempts to create a national curriculum.

Figure 1 Taken from the NAPLAN 2013 Technical Report, p.19

This extract shows the path from a raw score on a NAPLAN test and what eventually becomes a ‘scale score’ – per domain.  It is important to note that the scale score isn’t a count – it is based on a set of interlocking estimations that align (calibrate) the test items. That ‘logit’ score is based on the overall probability of test items being correctly answered. 

James Ladwig is Associate Professor in the School of Education at the University of Newcastle and co-editor of the American Educational Research Journal.  He is internationally recognised for his expertise in educational research and school reform.  Find James’ latest work in Limits to Evidence-Based Learning of Educational Science, in Hall, Quinn and Gollnick (Eds) The Wiley Handbook of Teaching and Learning published by Wiley-Blackwell, New York (in press). James is on Twitter @jgladwig

References

Barber, M. (2015). How to Run A Government: So that Citizens Benefit and Taxpayers Don’t Go Crazy: Penguin Books Limited.

Callahan, R. E. (1962). Education and the Cult of Efficiency: University of Chicago Press.

Ladwig, J., & Luke, A. (2013). Does improving school level attendance lead to improved school level achievement? An empirical study of indigenous educational policy in Australia. The Australian Educational Researcher, 1-24. doi:10.1007/s13384-013-0131-y

  Ladwig, J. G. (2018). On the Limits to Evidence‐Based Learning of Educational Science. In G. Hall, L. F. Quinn, & D. M. Gollnick (Eds.), The Wiley Handbook of Teaching and Learning (pp. 639-658). New York: WIley and Sons.

Mockler, N., & Stacey, M. (2021). Evidence of teaching practice in an age of accountability: when what can be counted isn’t all that counts. Oxford Review of Education, 47(2), 170-188. doi:10.1080/03054985.2020.1822794

Main image:

DescriptionEnglish: Australian politician Mark Latham at the 2018 Church and State Summit
Date15 January 2018
Source“Mark Latham – Church And State Summit 2018”, YouTube (screenshot)
AuthorPellowe Talk YouTube channel (Dave Pellowe)

Q:Which major party will fully fund public schools? A:None. Here’s what’s happening

You would be forgiven for thinking that policy related to schooling is not a major issue in Australia. In the lead up to the federal election, scant attention has been paid to it during the three leaders’ debates. One of the reasons could be because the education policies of the major parties have largely converged around key issues.

Both Labor and the Coalition are promising to increase funding to schools but neither is prepared to fully fund government schools to the Schooling Resource Standard (SRS).  Under a Coalition government public schools will get up to 95 per cent of the Schooling Resource Standard by 2027, under a Labor government they will get 97 per cent by 2027. Either way we are talking two elections away and to what degree public schools will remain underfunded.

Both the Coalition and Labor plan to fully fund allprivate schools to the Schooling Resource Standard by 2023. Some private schools are already fully funded and many are already over funded

Yes, Labor is promising to put equality and redistribution back on the agenda in areas such as tax reform and childcare policy, but its Fair funding for Australian Schools policy fails to close the funding gap between what government schools get, and what they need.  And yes Labor is promising to put back the $14 billion cut from public schools by the Coalition’s Gonski 2.0 plan and will inject $3.3 billion of that during its 2019-22 term, if elected.

The point I want to make is neither major party is prepared to fully fund government schools to the level that is needed according to the Schooling Resource Standard.

I find this deeply disappointing.

There are certainly differences between Coalition and Labor education policies, the main being that Labor will outspend the Coalition across each education sector from pre-schools to universities.

However, as I see it, neither major party has put forward an education policy platform. Instead, they have presented a clutch of ideas that fail to address key issues of concern in education, such as dismantling the contrived system of school comparison generated by NAPLAN and the MySchool website, and tackling Australia’s massive and growing equity issues.

Both major parties believe that the best mechanism for delivering quality and accountability is by setting and rewarding performance outcomes. This approach shifts responsibility for delivering improvements in the system down the line.

And let’s get to standardised testing. There is a place for standardised tests in education. However, when these tests are misused they have perverse negative consequences including narrowing the curriculum, intensifying residualisation, increasing the amount of time spent on test preparation, and encouraging ‘gaming’ behaviour.

Labor has promised to take a serious look at how to improve the insights from tests like NAPLAN, but this is not sufficient to redress the damage they are doing to the quality of schooling and the schooling experiences of young people.

These tests can be used to identify weaknesses in student achievement on a very narrow range of curriculum outcomes but there are cheaper, more effective and less problematic ways of finding this out. And the tests are specifically designed to produce a range of results, so it is intended for some children to do badly; a fact missed entirely by the mainstream media coverage of NAPLAN results.

National testing, NAPLAN, is supported by both Labor and the Coalition. Both consistently tell us that inequality matters, but both know the children who underperform are more likely to come from communities experiencing hardship and social exclusion. These are the communities whose children attend those schools that neither major party is willing to fund fully to the Schooling Resource Standard.

Consequently, teachers in underfunded government schools are required to do the ‘heavy lifting’ of educating the young people who rely most on schooling to deliver the knowledge and social capital they need to succeed in life.

The performance of students on OECD PISA data along with NAPLAN show the strength of the link between low achievement and socio-economic background in Australia; a stronger link than in many similar economies. This needs to be confronted with proper and fair funding plus redistributive funding on top of that.

A misuse of standardised tests by politicians, inflamed by mainstream media, has resulted in teachers in our public schools being blamed for the persistent low achievement of some groups of children and, by extension, initial teacher education providers being blamed for producing ‘poor quality’ teachers.

There is no educational justification for introducing more tests, such as the Coalition’s proposed Year 1 phonics test. Instead, federal politicians need to give up some of the power that standardised tests have afforded them to intervene in education. They need to step away from constantly using NAPLAN results to steer education for their own political purposes. Instead they need to step up to providing fair funding for all of Australia’s schools.

I believe when the focus is placed strongly on outputs, governments are let ‘off the hook’ for poorly delivering inputs through the redistribution of resources. Improved practices at the local level can indeed help deliver system quality, but not when that system is facing chronic, eternal underfunding.

Here I must comment on Labor’s proposal to establish a  $280 million Evidence Institute for Schools.  Presumably, this is Labor’s response to the Productivity Commission’s recommendation to improve the quality of existing education data. Labor is to be commended for responding to this recommendation. The Coalition is yet to say how they will fund the initiative.

However what Labor is proposing is not what the Productivity Commission recommended. The Commission argued that performance benchmarking and competition between schools alone are insufficient to achieve gains in education outcomes. They proposed a broad ranging approach to improving the national education evidence base, including the evaluation of policies and building an understanding of how to turn what we know works into into common practice on the ground.

Labor claims that its Evidence Institute for Schools will ensure that teachers and parents have access to ‘high quality’ ‘ground breaking’ research, and it will be ‘the right’ research to assist teachers and early educators to refine and improve their practice.

As an educational researcher, I welcome all increases in funding for research but feel compelled to point out according to the report on Excellence in Research for Australia that was recently completed by the Australian Research Council, the vast majority of education research institutions in Australia are already producing educational research assessed to be of or above world class standard.

The problem is not a lack of high quality research, or a lack of the right kind of research. Nor is it the case that teachers do not have access to research to inform their practice. Without a well-considered education platform developed in consultation with key stakeholders, this kind of policy looks like a solution in search of a problem, rather than a welcome and needed response to a genuine educational issue.

Both major parties need to do more to adequately respond to the gap in the education evidence base identified by the Productivity Commission. This includes a systematic evaluation of the effects of education policies, particularly the negative effects of standardised tests.

The people most affected by the unwillingness of the major parties to imagine a better future for Australia’s schools are our young people, the same young people who are demanding action on the climate crisis. They need an education system that will give them the best chance to fix the mess we are leaving them. Until we can fully fund the schools where the majority of them are educated in Australia we are failing them there too.

Dr Debra Hayes is Head of School and Professor, Education & Equity at the Sydney School of Education and Social Work, University of Sydney. She is also the President of the Australian Association for Research in Education. Her next book, co-authored with Craig Campbell, will be available in August – Jean Blackburn: Education Feminism and Social Justice (Monash University Press). @DrDebHayes

NAPLAN is not a system-destroying monster. Here’s why we should keep our national literacy and numeracy tests

Australia’s numeracy and literacy testing across the country in years 3, 7, and 9 is a fairly bog standard literacy and numeracy test. It is also a decent, consistent, reliable, and valid assessment process. I believe the National Assessment Program-Literacy and Numeracy (NAPLAN) is a solid and useful assessment.

Education experts in Australia have carefully designed the testing series. It has good internal consistency among the assessment items. It has been shown to produce consistent results over different time points and is predictive of student achievement outcomes.

However there are special characteristics of NAPLAN that make it a target for criticisms.

Special characteristics of NAPLAN

What is particularly special about NAPLAN is that most students around the country do it at the same time and the results (for schools) are published on the MySchool website. Also, unlike usual in-house Maths and English tests, it was developed largely by the Australian Government (in consultation with education experts), rather than being something that was developed and implemented by schools.

These special characteristics have meant that NAPLAN has been under constant attack since its inception about 10 years ago. The main criticisms are quite concerning.

Main criticisms of NAPLAN

  • NAPLAN causes a major distortion of the curriculum in schools in a bad way.
  • NAPLAN causes serious distress for students, and teachers.
  • NAPLAN results posted on MySchool are inappropriate and are an inaccurate way to judge schools.
  • NAPLAN results are not used to help children learn and grow.
  • NAPLAN results for individual children are associated with a degree of measurement error that makes them difficult to interpret.

The above criticisms have led to calls to scrap the testing altogether. This is a rather drastic suggestion. However, if all the criticisms above were true then it would be hard to deny that this should be a valid consideration.

Missing Evidence

A problem here is that, at present, there does not exist any solid evidence to properly justify and back up any of these criticisms. The Centre for Independent Studies published an unashamedly pro-NAPLAN paper that does a fair job at summarising the lack of current research literature. However, as the CIS has a clearly political agenda, this paper needs to be read with a big pinch of salt.

My Criticisms  

Rather than completely dismissing the criticisms due to lack of evidence, as was done in the CIS paper mentioned above, based on my own research and knowledge of the literature I would revise the criticisms to:

  • In some (at present indeterminate) number of schools some teachers get carried away with over-preparation for NAPLAN, which unnecessarily takes some time away from teaching other important material.
  • NAPLAN causes serious distress for a small minority of students, and teachers.
  • Some people incorrectly interpret NAPLAN results posted on MySchool as a single number that summarises whole school performance. In fact school performance is a multi-faceted concept and NAPLAN is only a single piece of evidence.
  • It is currently unclear to what extent NAPLAN results get used to help children at the individual level as a single piece of evidence for performance within a multi-faceted approach (that is, multiple measurement of multiple things) generally taken by schools.
  • While NAPLAN results are associated with a degree of measurement error, so too are any other assessments, and it is unclear whether NAPLAN measurement error is any greater or less compared to other tests.

I realise my views are not provocative compared with the sensationalized headlines that we constantly see in the news. In my (I believe soberer) view, NAPLAN becomes more like any other literacy and numeracy test rather than some education-system-destroying-monster.

NAPLAN has been going for about 10 years now and yet there is no hard evidence in the research literature for the extreme claims we constantly hear from some academics, politicians, and journalists.

My views on why NAPLN has been so demonised

From talking to educators about NAPLAN, reviewing the literature, and conducting some research myself, it is clear to me that many educators don’t like how NAPLAN results are reported by the media. So I keep asking myself why do people mis-report things about NAPLAN so dramatically? I have given some thought to it and believe it might be because of a simple and very human reason: people like to communicate what they think other people want to hear.

But this led me to question whether people really do interpret the MySchool results in an inappropriate way. There is no solid research that exists to answer this question. I would hypothesize however that when parents are deciding on a school to send their beloved child, they aren’t making that extremely important decision based on a single piece of information. Nor would I expect that even your everyday Australian without kids really thinks that a school’s worth is solely to be judged based on some (often silly) NAPLAN league table published by a news outlet.

I also think that most people who are anti-NAPLAN wouldn’t really believe that is how people judge schools either. Rather, it is more the principle of the matter that is irksome. That the government would be so arrogant as to appear to encourage people to use the data in such a way is hugely offensive to many educators. Therefore, even if deep down educators know that people aren’t silly enough to use the data in such an all-or-none fashion, they are ready to believe in such a notion, as it helps to rationalize resentment towards NAPLAN.

Additionally, the mantra of ‘transparency and accountability’ is irksome to many educators. They do so much more than teach literacy and numeracy (and even more than what is specifically assessed by NAPLAN). The attention provided to NAPLAN draws attention away from all the additional important hard work that is done. The media constantly draws attention to isolated instances of poor NAPLAN results while mostly ignoring all the other, positive, things teachers do.

Also I will point out, schools are already accountable to parents. So, in a way, the government scrutiny and control sends a message to teachers that they cannot be trusted and that the government must keep an eye on them to make sure they are doing the right thing.

I can understand why many educators might be inclined to have an anti-NAPLAN viewpoint. And why they could be very ready to believe in any major criticisms about the testing.

NAPLAN has become the assessment that people love to hate. Therefore the over-exaggerated negative claims about it are not particularly surprising even if, technically, things might not be so bad, or even bad at all.

My experience with the people who run the tests

In the course of carrying out my research I met face-to-face with some of the people running the tests. I wanted to get some insights into their perspective. I tried my best to go into the meeting with an open mind so what I wasn’t anticipating was an impression of weariness. I found myself feeling sorry for them more than anything else. They did not enjoy being perceived as the creepy government officials looking over the fence at naughty schools.

Rather, they communicated a lot of respect for schools and the people that work in them and had a genuine and passionate interest in the state of education in our country. They saw their work as collecting some data that would be helpful to teachers, parents and governments.

They pointed out the MySchool website does not produce league tables. A quote from the MySchool website is: “Simple ‘league tables’ that rank and compare schools with very different student populations can be misleading and are not published on the My School website”.

Personally, I think it is a shame that NAPLAN testing series has not been able to meet its full potential as a useful tool for teachers, parents, schools, researchers and governments ( for tracking students, reporting on progress, providing extra support, researching on assessment, literacy and numeracy issues and allocating resources).

Value of NAPLAN to educational researchers

Where NAPLAN has huge potential, generally not well recognized, is its role in facilitating educational research conducted in schools. Schools are very diverse, with diverse practices. Whereas NAPLAN is a common experience. It is a thread of commonality that can be utilized to conduct and facilitate research across different schools, and across different time points. The NAPLAN testing has huge potential to facilitate new research and understanding into all manner of important factors surrounding assessment and literacy and numeracy issues. We have an opportunity to better map out the dispositional and situational variables that are associated with performance, with test anxiety, and engagement with school. The number of research studies being produced that are making use of NAPLAN is increasing and looks set to continue increasing in the coming years (as long as NAPLAN is still around). There is real potential for some very important research making good use of NAPLAN to come out of Australian universities in the coming years. There is possibility for some really impressive longitudinal research to be done.

Another positive aspect that is not widely recognized but is something mentioned by parents in research I have conducted, is that NAPLAN tests might be useful for creating a sense of familiarity with standardized testing which is helpful for students who sit Year 12 standardized university entrance exams. Without NAPLAN, students would be going into that test experience cold. It makes sense that NAPLAN experience should make the year 12 tests a more familiar experience prior to sitting them, which should help alleviate some anxiety. Although I must acknowledge that this has not received specific research attention yet.

Perhaps focusing on the importance of NAPLAN to research that will benefit schooling (teachers, parents, schools) in Australia might help change the overall narrative around NAPLAN.

However there are definitely political agendas at work here and I would not be surprised if NAPLAN is eventually abandoned if the ‘love to hate it’ mindset continues. So I encourage educators to think for themselves around these issues, and instead of getting caught up in political machinations, if you find yourself accepting big claims about how terrible NAPLAN supposedly is, please ask yourself: Do those claims resonate with me? Or is NAPLAN just one small aspect of what I do? Is it just one single piece of information that I use as part of my work? Would getting rid of NAPLAN really make my job any easier? Or would I instead lose one of the pieces of the puzzle that I can use when helping to understand and teach my students?

If we lose NAPLAN I think we will, as a country, lose something special that helps us better understand our diverse schools and better educate the upcoming generations of Australian students.


Dr Shane Rogers is a Lecturer in the School of Arts and Humanities at Edith Cowan University. His recent publications include Parent and teacher perceptions of NAPLAN in a sample of Independent schools in Western Australia in The Australian Educational Researcher online, and he is currently involved in research on What makes a child school ready? Executive functions and self-regulation in pre-primary students.